Figure 1 shows the
dispersion diagrams. A high correlation
was obtained between the [H+] values calculated by the traditional
and simplified Stewart equations (r = 0.999; p<0.001); however the
correlation coefficients between the measured [H+] values and those
determined by the two forms of the Stewart equation were both <0.50 (r =
0.491; p<0.001, and r = 0.492; p<0.001), respectively).
The mean measured pH
and [H+] values were significantly different to those calculated by
either Stewart equations (Table 2). However, no significant differences were
seen between the pH and [H+] values calculated with either of the
Stewart equations at any particular time point (0, 10, 20 or 30 min) (Table
2). The average difference between the
mean [H+] values determined by the traditional and proposed Stewart
equations was 0.004 ± 0.013 nmol.L-1, while that between the mean measured [H+]
values and the traditional Stewart equation-determined results was 8.723 ± 6.032 nmol.L-1. Similar differences were obtained in comparisons
between the mean measured and the proposed Stewart equation-determined results
(8.727 ± 6.031 nmol.L-1). Figure 1 shows the Bland and Altman graphs
for [H+], in which these comparisons can be seen.
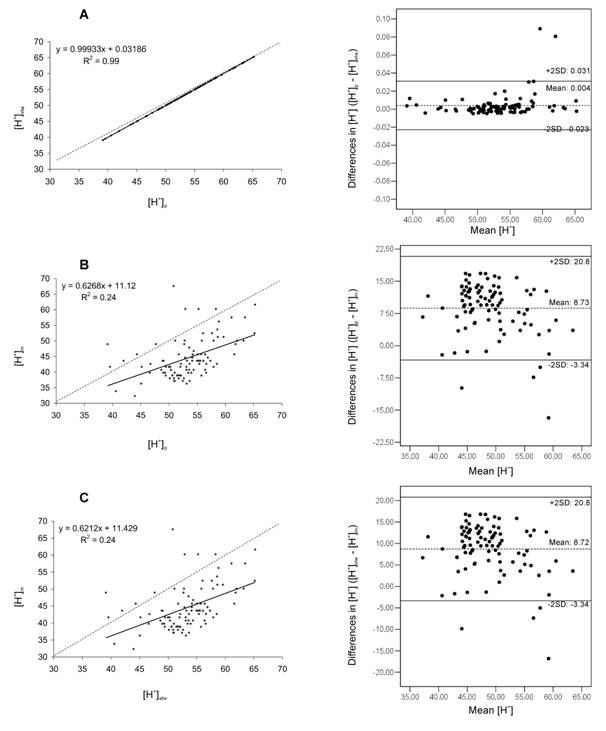
Fig. 1. The graphs at the left represent the linear regression
analysis (continuous line) and the line of complete similarity (dotted line)
for [H+]. A) Stewart ecuation vs. proposed, simplified
Stewart equation (nmol·L-1). B) Measured values vs. proposed,
simplified Stewart equation (nmol·L-1). C) Measured values vs.
traditional Stewart equation (nmol·L-1).
We have found a
little contribution of coefficients D and E of the Stewart´s equation, which
allow the possibility to work with a second degree equation obtaining similar
results. The results of the present work differ to those obtained by other
authors (4, 6, 18-20). Significant differences
were seen between the measured and Stewart equation-estimated (either form) [H+].
However, no significant differences were seen between the [H+] determined
by the traditional and proposed Stewart equations. The Bland and Altman procedure (17) confirmed
the validity of the proposed equation (Fig. 1A), which can therefore be used in
place of the mathematically more complex traditional Stewart equation.
The differences
between the mean [H+] values measured in the capillary blood and
those determined using either equation were >8 nmol·L-1; this
contrasts with the results obtained by Kowalchuk and Scheuermann (1994, 1995)
who reported the difference in the mean measured and traditional Stewart
equation-derived [H+] values to be <3 nmol·L-1 (2.1±
7.2 nmol.L-1). Heenan y Wolfe (2000) reported similarly small
differences in their study of pregnant women.
However, the differences detected by these other authors were also
significant. In addition, (4) found a
strong correlation between the mean measured and estimated [H+]
values (r =0.81), while in the present work the correlation coefficient was r
<0.50. Other authors report significant differences between mean measured [H+]
values and those calculated using the traditional Stewart equation (19, 20),
along with a correlation coefficient of
r = 0.99 (18). However, none of these authors used Bland and Altman
graphs to validate the Stewart equation. In the present work, these graphs
showed a poor agreement between the measured [H+] values and those
determined by the traditional (Fig. 1C) and proposed, simplified (Fig. 1B)
equations. Taking in accuount the poor agreement and low correlation in our
study (r = 0.49) is possible to argue that both equations are inappropriate to
determine the [H+], but the Stewart´s approach offers a deeper
knowledge of the acid-base status (22). The reasons to
explain why Stewart´s equation could fail when determinig the pH are difficult
to explain and could be related with the impossibilty to measure all the strong
ions or determine ATOT. Also, the temperature and ionic
strength of the plasma are influencing the values of the equilibrium constants
(see also below).
When the plasma [H+]
is >55 nmol·L-1, the differences between the measured and
calculated values have been reported to increase (4), but in the present study
the difference remained the same throughout.
In the study of Kowalchuk et al. (1988) calculated and measured [H+]
were closely comparable, apart from arterial plasma at rest, where there was a
marked variability between the subjects.
The reasons for the
differences between the results of this study and those of other authors could
be due to several factors. Although
several works have shown no differences in acid-base measurements depending on
the type of blood (23, 24), we used capillary blood while Weinstein et al.
(1991) used venous blood, Kowalchuk and
Scheuermann (1994) used arterialised venous blood, and Fedde and Pieschl (1995)
used arterial blood. Secondly, [ATOT] was not measured in the
present work; rather, the mean value reported by (4, 5) was used; [ATOT]
(or [PTOT]) appears to influence the results much less than [SID] or
PCO2 (18). In addition, errors in the measurement of [ATOT]
do not appear to influence the calculated [H+] values when the [SID]
is close to 40 mequiv·L-1 (4, 16). Finally, errors in the
measurement of the independent variables with most influence on [H+]
- PCO2 and [SID] – may explain some of these differences. Both
variables determine the coefficients of the traditional and proposed Stewart
equations. The values obtained for these variables were similar to those obtained
in all other studies. Although the
coefficients D and E have been eliminated in the propoesed equation, we
consider that the physiological impact of deleting them is low because PCO2
is the only independient variable included in them.
The methodology used
to measure the pH, PCO2, and the strong ion (Na+, K+,
Ca+2 and Cl-) and lactate concentrations was similar to
that employed by (4). Kowalchuk and Scheuermann (1995) reported that
differences between the measured and calculated [H+] values in their
study might be due to the fact not all the strong ions are measured, leading to
an inaccurate [SID]. Finally, errors in the values of the equilibrium constants
used to determine the coefficients of the Stewart equation may explain some of
these differences. In the present study,
values recommended in the literature were used, which correspond to a blood
plasma temperature of 37ºC (3, 5, 9, 12). These
constants, however, are dependent on the temperature and ionic strength of the
plasma. Nonetheless, the use of incorrect values is only associated with small
errors since the Stewart equation is largely insensitive to inaccuracies in the
majority of the dissociation constants (4, 5, 16). In the present work, the
same values were assumed for the equilibrium constants independent of the
difference between the central and peripheral temperatures during exercise. In
addition, although the constant load exercise was assumed
to have been performed at a constant body temperature, it is likely that it was
not the same at the beginning and the end of the exercise. However, the effect of increasing temperature
on the factors required to determine the Stewart equation constants is
negligible from a biological point of view (25). Further, temperature variation
cannot explain the differences between the mean measured and Stewart equation-derived
(either form) [H+] values.
None of the studies
mentioned above discuss the mathematical procedure used to solve the polynomial
Stewart equation, yet this is important when trying to determine the possible
causes of differences in the measured and estimated [H+] values.
5. CONCLUSIONS
In
conclusion, neither the Stewart equation nor the proposed simplified version
appear to provide a particularly valid estimate of [H+] when
compared to experimentally obtained results.
However, the
simplified equation can be employed in lieu of the full equation
since it provides the same results yet is easier to use. Future work should examine the estimates
provided by the proposed equation in conditions of severe acidosis, in which
the [H+] is higher than that studied in the present work.
6. PHYSIOLOGICAL RELEVANCE
- The physicochemical analysis of body fluid acid-base status
developed by Stewart is used in a several fields.
- To solve the Stewart´s equation has the disadvantage to work with a
four degree equation and specific software.
- The contribution of coefficients D and E is little to the final
result and can be eliminated from the equation, obtaining a second dregree
equation easier to solve.
- Neither Stewart´s equation nor proposed equation
in this work are able to make a good estimation of [H+].
7. REFERENCES
1. Constable PD. A simplified strong ion
model for acid-base equilibria: application to horse plasma. J Appl Physiol.
1997 Jul;83(1):297-311.
2. Heigenhauser GJ. A
quantitative approach to acid-base chemistry. Can J Appl Physiol. 1995
Sep;20(3):333-40.
3. Stewart PA. Modern
quantitative acid-base chemistry. Can J Physiol Pharmacol. 1983 Dec;61(12):1444-61.
4. Kowalchuk JM, Scheuermann BW. Acid-base
regulation: a comparison of quantitative methods. Can J Physiol Pharmacol. 1994
Jul;72(7):818-26.
5. Kowalchuk JM, Scheuermann BW. Acid-base
balance: origin of plasma [H+] during exercise. Can J Appl Physiol. 1995 Sep;20(3):341-56.
6. Kowalchuk JM, Heigenhauser GJ,
Lindinger MI, Sutton JR, Jones NL. Factors influencing
hydrogen ion concentration in muscle after intense exercise. J Appl
Physiol. 1988 Nov;65(5):2080-9.
7. Lindinger MI. Origins of [H+] changes
in exercising skeletal muscle. Can J Appl Physiol. 1995 Sep;20(3):357-68.
8. Tuhay G, Pein MC, Masevicius FD,
Kutscherauer DO, Dubin A. Severe hyperlactatemia with normal base excess: a
quantitative analysis using conventional and Stewart approaches. Crit Care.
2008;12(3):R66.
9. Figge J, Rossing TH, Fencl V. The role of serum proteins in acid-base equilibria. J Lab
Clin Med. 1991 Jun;117(6):453-67.
10. Kurtz I, Kraut J, Ornekian V, Nguyen MK.
Acid-base analysis: a critique of the Stewart and bicarbonate-centered
approaches. Am J Physiol Renal Physiol. 2008 May;294(5):F1009-31.
11. Fidkowski C, Helstrom J. Diagnosing
metabolic acidosis in the critically ill: bridging the anion gap, Stewart, and
base excess methods. Can J Anaesth. 2009 Mar;56(3):247-56.
12. Stewart PA. How to understand acid - base:
a quantitative acid - base primer for biology and medicine. New York: Elsevier
North Holland; 1981.
13. Peinado PJ, Di Salvo V, Pigozzi F,
Bermudez AI, Peinado Lozano AB, Calderon Montero FJ, et al. Steady-state
acid-base response at exercise levels close to maximum lactate steady state.
Clin J Sport Med. 2006 May;16(3):244-6.
14. Wasserman K, Whipp BJ, Koyl SN, Beaver WL.
Anaerobic threshold and respiratory gas exchange during exercise. J Appl
Physiol. 1973 Aug;35(2):236-43.
15. Gaskill SE, Ruby BC, Walker AJ, Sanchez
OA, Serfass RC, Leon AS. Validity and reliability of
combining three methods to determine ventilatory threshold. Med Sci Sports Exerc. 2001 Nov;33(11):1841-8.
16. Fedde MR, Pieschl RL, Jr. Extreme
derangements of acid-base balance in exercise: advantages and limitations of
the Stewart analysis. Can J Appl Physiol. 1995 Sep;20(3):369-79.
17. Bland JM, Altman DG. Statistical
methods for assessing agreement between two methods of clinical measurement.
Lancet. 1986 Feb 8;1(8476):307-10.
18. Weinstein Y, Magazanik A, Grodjinovsky A,
Inbar O, Dlin RA, Stewart PA. Reexamination of Stewart's
quantitative analysis of acid-base status. Med Sci
Sports Exerc. 1991 Nov;23(11):1270-5.
19. Preston RJ, Heenan AP, Wolfe LA.
Physicochemical analysis of phasic menstrual cycle effects on acid-base
balance. Am J Physiol Regul Integr Comp Physiol. 2001 Feb;280(2):R481-7.
20. Kemp JG, Greer FA, Wolfe LA. Acid-base regulation after maximal exercise testing in late
gestation. J Appl Physiol. 1997 Aug;83(2):644-51.
21. Heenan AP, Wolfe LA. Plasma
acid-base regulation above and below ventilatory threshold in late gestation.
J Appl Physiol. 2000 Jan;88(1):149-57.
22. Lindinger MI, Kowalchuk JM, Heigenhauser
GJ. Applying
physicochemical principles to skeletal muscle acid-base status. Am J Physiol Regul Integr Comp Physiol. 2005 Sep;289(3):R891-4.
23. Forster HV, Dempsey JA,
Thomson J, Vidruk E, DoPico GA. Estimation of arterial PO2, PCO2, pH, and
lactate from arterialized venous blood. J Appl Physiol. 1972 Jan;32(1):134-7.
24. Linderman J, Fahey TD, Lauten G, Brooker
AS, Bird D, Dolinar B, et al. A comparison of blood gases and acid-base
measurements in arterial, arterialized venous, and
venous blood during short-term maximal exercise. Eur J Appl Physiol Occup
Physiol. 1990;61(3-4):294-301.
25. Johnson RLJ, Heigenhauser GJF, Hsia CCW,
Jones NL, Wagner PD. Determinants of gas exchange and acid-base balance during
exercise. Handbook of physiology Section
12 Exercise: regulation and integration of multiple systems; 1996.
Rev.int.med.cienc.act.fís.deporte- vol. 11 - número 41 - marzo 2011 - ISSN: 1577-0354